Three Different Concepts of Probability
The classical interpretation of probability is a theoretical probability based on the physics of the experiment, but does not require the experiment to be performed. For example, we know that the probability of a balanced coin turning up heads is equal to 0.5 without ever performing trials of the experiment. Under the classical interpretation, the probability of an event is defined as the ratio of the number of outcomes favorable to the event divided by the total number of possible outcomes.
Sometimes a situation may be too complex to understand the physical nature of it well enough to calculate probabilities. However, by running a large number of trials and observing the outcomes, we can estimate the probability. This is the empirical probability based on long-run relative frequencies and is defined as the ratio of the number of observed outcomes favorable to the event divided by the total number of observed outcomes. The larger the number of trials, the more accurate the estimate of probability. If the system can be modeled by computer, then simulations can be performed in place of physical trials.
A manager frequently faces situations in which neither classical nor empirical probabilities are useful. For example, in a one-shot situation such as the launch of a unique product, the probability of success can neither be calculated nor estimated from repeated trials. However, the manager may make an educated guess of the probability. This subjective probability can be thought of as a person's degree of confidence that the event will occur. In absence of better information upon which to rely, subjective probability may be used to make logically consistent decisions, but the quality of those decisions depends on the accuracy of the subjective estimate.
Outcomes and Events
An event is a subset of all of the possible outcomes of an experiment. For example, if an experiment consists of flipping a coin two times, the possible outcomes are:
- heads, heads
- heads, tails
- tails, heads
- tails, tails
One can define the showing of heads at least one time to be an event, and this event would consist of three of the four possible outcomes.
Given that the probability of each outcome is known, the probability of an event can be determined by summing the probabilities of the individual outcomes associated with the event.
A composite event is an event defined by the union or intersection of two events. The union of two events is expressed by the "or" function. For example, the probability that either Event A or Event B (or both) will occur is expressed by P(A or B). The intersection of two events is the probability that both events will occur and is expressed by the "and" function. For exampe, the probability that both Event A and Event B will occur is expressed by P(A and B).
Law of Addition
Consider the following Venn diagram in which each of the 25 dots represents an outcome and each of the two circles represents an event.

In the above diagram, Event A is considered to have occurred if an experiment's outcome, represented by one of the dots, falls within the bounds of the left circle. Similarly, Event B is considered to have occurred if an experiment's outcome falls within the bounds of the right circle. If the outcome falls within the overlapping region of the two circles, then both Event A and Event B are considered to have occurred.
There are 5 outcomes that fall in the definition of Event A and 6 outcomes that fall in the definition of Event B. Assuming that each outcome represented by a dot occurs with equal probability, the probability if Event A is 5/25 or 1/5, and the probability of Event B is 6/25. The probability of Event A or Event B would be the total number of outcomes in the orange area divided by the total number of possible outcomes. The probability of Event A or Event B then is 9/25.
Note that this result is not simply the sum of the probabilities of each event, which would be equal to 11/25. Since there are two outcomes in the overlapping area, these outcomes are counted twice if we simply sum the probabilities of the two events. To prevent this double counting of the outcomes common to both events, we need to subtract the probability of those two outcomes so that they are counted only once. The result is the law of addition, which states that the probability of Event A or Event B (or both) occurring is given by:
P(A or B) = P(A) + P(B) - P(A and B)
This addition rule is useful for determining the probability that at least one event will occur. Note that for mutually exclusive events there is no overlap of the two events so:
P(A and B) = 0
and the law of addition reduces to:
P(A or B) = P(A) + P(B)
Conditional Probability
Sometimes it is useful to know the probability that an event will occur given that another event occurred. Given two possible events, if we know that one event occurred we can apply this information in calculating the other event's probability. Consider the Venn diagram of the previous section with the two overlapping circles. If we know that Event B occurred, then the effective sample space is reduced to those outcomes associated with Event B, and the Venn diagram can be simplified as shown:
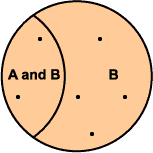
The probability that Event A also has occurred is the probability of Events A and B relative to the probability of Event B. Assuming equal probability outcomes, given two outcomes in the overlapping area and six outcomes in B, the probability that Event A occurred would be 2/6. More generally,
P(A given B) = P(A and B) /P(B)
Law of Multiplication
The probability of both events occurring can be calculated by rearranging the terms in the expression of conditional probability. Solving for P(A and B), we get:
P(A and B) = P(A given B) x P(B)
For independent events, the probability of Event A is not affected by the occurance of Event B, so P(A given B) = P(A), and
P(A and B) = P(A) x P(B)


